

New Data Shows US Air Quality Rankings by State: Wyoming and Hawaii Lead, California Trails for 2026
Wyoming and Hawaii Lead in Clean Air, While California and Ohio Struggle with Pollution
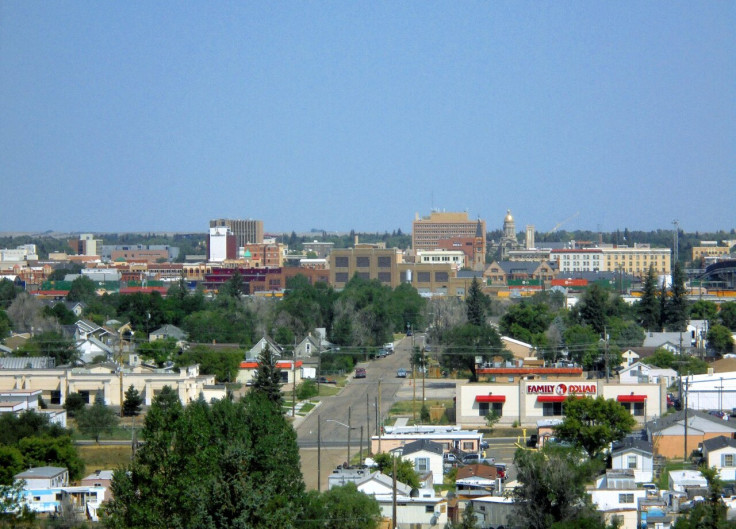
New air quality data released this year shows a wide gulf between the cleanest and most polluted states in the country, with sparsely populated Western and Pacific states such as Wyoming and Hawaii consistently ranking among the healthiest for air quality, while densely populated, industrial states including California, Pennsylvania and Ohio continue to post some of the worst readings in the nation.
Two separate analyses released in early 2026, using slightly different methodologies, arrived at broadly similar conclusions about which states offer the cleanest air. An analysis published in March, based on fine particulate pollution, or PM2.5, levels averaged from 2022 through 2024, found that the U.S. average stood at 8.8 micrograms per cubic meter, well above the World Health Organization's air quality guideline of 5 micrograms per cubic meter, meaning the average American is breathing air that falls short of internationally recognized health standards.
According to that analysis, Wyoming posted the cleanest air in the country, a result researchers attributed largely to the state's vast, sparsely populated landscape and minimal industrial development. Wyoming's city of Casper recorded the lowest year-round particle pollution of any metro area tracked in the report, while the state capital, Cheyenne, ranked eighth overall among individual cities nationwide. Hawaii ranked second among states for particle pollution, posting a reading of 4.7 micrograms per cubic meter, a result researchers linked to the state's low population density combined with strong prevailing winds and consistent rainfall that help disperse pollutants before they can accumulate.
At the opposite end of that same ranking, California posted the worst air quality of any state, with a reading of 11.7 micrograms per cubic meter, more than double the WHO's recommended guideline. Researchers pointed to a combination of factors driving California's poor performance, including high population density, a significant concentration of industrial facilities, heavy vehicle emissions, and a climate pattern that helps fuel frequent and severe wildfires across the state. Pennsylvania, Michigan, Illinois and Ohio rounded out the bottom five states in that same analysis. New York, despite its dense population and substantial industrial activity, posted a comparatively better reading of 7.8 micrograms per cubic meter, below the national average, a result researchers attributed to stricter state-level emission standards and geographic factors that help disperse pollution more effectively than some other major urban centers.
A separate ranking, compiled using a different methodology based on the U.S. News Best States framework, produced a notably different picture at the bottom of the list, though it largely agreed on the cleanest states at the top. That analysis found Hawaii posting the best average air quality index in the country, at 21.2, comfortably within the "good" range on the standard AQI scale. Honolulu was cited as one of just six U.S. cities to rank on all three of the American Lung Association's cleanest-cities lists, covering ozone pollution, year-round particle pollution and short-term particle pollution. Alaska ranked second-best under this methodology, with an index of 29.1, despite localized particle pollution problems in areas like Anchorage and the Matanuska-Susitna Borough tied to wood-burning home heating systems, both of which have reportedly seen air quality improvements in recent years. Washington state ranked third-best, with an index of 33.5, though the analysis noted that some residents in the state still experience unhealthy air linked to emissions from power plants.
Under this second ranking system, Utah posted the worst average air quality index in the country, at 51.2, placing it in the "moderate" category on the AQI scale rather than "good." Researchers attributed much of Utah's poor performance to its mountainous topography, which tends to trap pollution near the surface rather than allowing it to disperse, a phenomenon sometimes referred to as a temperature inversion. The report noted that Utah has taken active steps in recent years to address the issue, including expanding solar energy use and enacting roughly 30 new regulatory rules aimed at reducing emissions from various pollution sources. Ohio and Georgia tied for the second-worst air quality under this ranking, each posting an index of 48.2, with Ohio's reading sitting just barely within the "good" range despite the tie.
At the city level, separate rankings drawing on real-time EPA AirNow monitoring data have continued to highlight California's Central Valley as home to some of the most consistently polluted urban areas in the country. Bakersfield has repeatedly ranked as the most polluted city in the United States in 2026 tracking, a result researchers tied to the city's geography within the southern San Joaquin Valley, where surrounding mountains on three sides trap agricultural dust, oil refining emissions and vehicle exhaust close to the ground. Fresno, located roughly 110 miles north of Bakersfield within the same valley, faces nearly identical geographic and pollution challenges, with winter temperature inversions frequently trapping wood smoke and vehicle exhaust and pushing air quality readings above 150 on the standard index, a level considered unhealthy for the general public.
Notably, one analysis pointed out that California's poor air quality rankings are not primarily a reflection of weak environmental regulation. The report specifically noted that California maintains the strictest air quality laws in the nation, but that the state's unique combination of Central Valley geography, massive population size, extensive agricultural activity and wildfire exposure continues to overwhelm those regulatory efforts in terms of measurable pollution outcomes.
Beyond the state and city-level rankings, researchers have continued to emphasize the tangible health implications tied to these disparities. According to analysis comparing the cleanest and most polluted metro areas in the country, residents of the worst-ranking cities breathe air with PM2.5 concentrations three to five times higher than those living in the cleanest cities, a gap researchers say translates into measurable differences in respiratory disease rates, cardiovascular health outcomes and even overall life expectancy between regions.
With wildfire smoke, industrial emissions and regional geography continuing to shape which states and cities post the best and worst air quality readings each year, researchers say the underlying rankings are likely to remain relatively consistent from year to year, even as individual pollution events, such as this summer's wildfire smoke drifting south from Canada, continue to produce short-term spikes in unhealthy air quality readings across parts of the country that otherwise post comparatively clean averages.
© Copyright 2026 IBTimes AU. All rights reserved.