World’s first digital map of seafloor geology by Sydney U helps tell how oceans responded to climate change
A digital map of seafloor geology created by University of Sydney researchers will help scientists understand better the impact of environmental change on oceans. Studying the composition of phytoplankton remains can assist in deciphering how oceans responded in the past to climate change.
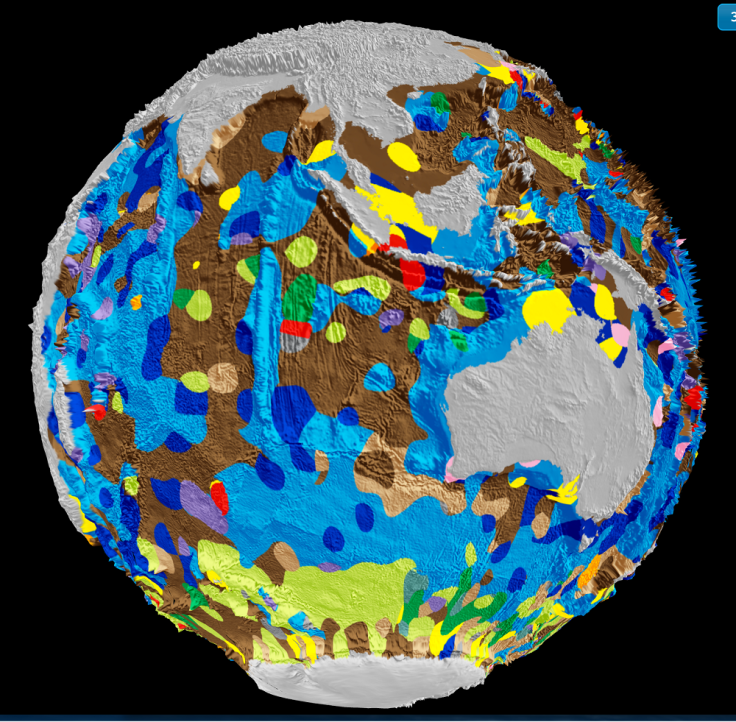
The map, a global first, provides a detailed distribution of the composition of the ocean seafloor that covers 70 percent of the Earth’s surface. The details record the changes over 40 years, reports Perfscience.
The first map of the seafloor was hand-drawn in the 1970s and relied heavily on assumptions. It used a five-colour key, reports The Sydney Morning Herald which published a copy of the map. The map used grey to represent continental sediment, brown for abyssal clay, blue for calcareous ooze, dark green for radiolarian ooze and light green for diatom ooze.
Adriana Dutkiewicz, lead researcher from the University of Sydney, explains, “The deep ocean floor is a graveyard with much of it made up of the remains of microscopic sea creatures called phytoplankton, which thrive in sunlit surface waters.” Diatoms, a group of phytoplanktons, lead to the production of almost a quarter of the oxygen inhaled by the Earth’s inhabitants and play a major role in addressing global warming in comparison to plants.
The map says diatom buildups on the seafloor are almost 100 percent independent on the diatom in surface waters in the Southern Ocean.
Dietmar Muller, geophysicist at the university’s School of Geosciences, points out that the first map showed a relatively featureless and barren place. Large tracts of the ocean floor were believed to have been covered by just one type of sediment.
Muller says the new map - which uses 13 colours including yellow for sand, red for volcanic rock and pink for shells and corals – “brings out the enormous ecological and geological complexity of the seafloor that before we had no idea about.”
More than 15,000 sea floor samples were generate to make the new map. The pinks in the map include the Great Barrier Reef in Australia, the shell deposits in the Arafura Sea west of the Cape York peninsula, Western Australia’s south-west corner and a part of the Great Australian Bight.
Contact the writer at feedback@ibtimes.com.au or tell us what you think below
- MOST POPULAR IN Science