

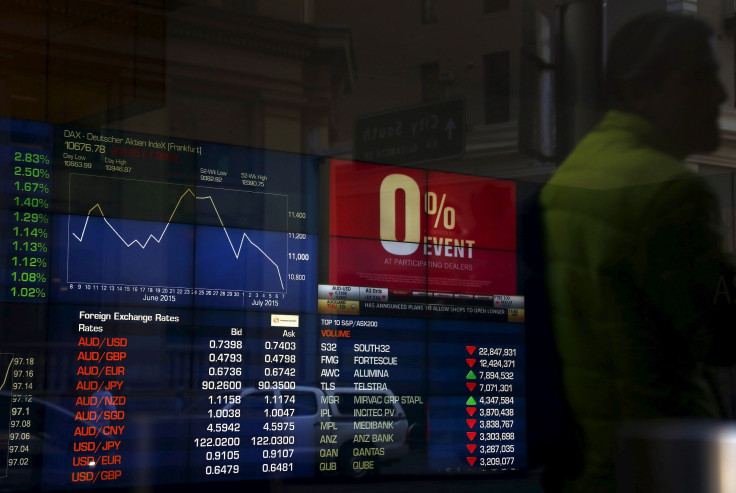
Global Markets Overview - Dec. 15, 2015
Is it time to be bold and buy?
Equites markets are closing in on that ‘critical mass’ point where underlying macro and micro fundamentals are thrown out the door and the mass momentum trade takes over – in fact, we are probably already there.
This means we need to start asking the next big question, is it time to buy?
No market participant will ever pick a bottom or top perfectly but they can see the signs of when each is forming.
March-April this year is a clear example of a topping situation; valuations had gone beyond stretched, the underlying fundamentals were not justifying the index to be touching 6000 points as investors became one-eyed on yields, which led to upside trading records consistently being broken on the momentum.
A similar situation is currently developing on the downside, and this is what leads us to believe we are nearing a bottom.
Nearing the bottom
· The ASX logged its fifth consecutive decline yesterday. It has only logged six consecutive declines three times since December and it has never logged seven.
· The ASX has now declined eight out of the past nine days – something it has only done once in 2015 and three time in the past four years. The longest sustained decline was nine out ten consecutive trading days, which occurred in September last year.
· The price/earnings (P/E) ratio correlation are also becoming over stretched on the downside. Compared to the 12-month blended forward P/E ratio to the ASX cash market, the ASX is trading at about 13.9 times the lowest level in two years. Yet, its current P/E has it at 18 times. Markets, in theory, are forward looking – the forward blended P/E on a historical basis is entering ‘cheap’ levels.
· The underlying commodity markets are also reaching some critical levels – iron ore is falling but is showing signs of responding to news that Chinese smelters are being cut back.
· Oil is also showing signs it’s at the ‘capitulation’ point, with record levels of short interest in WTI, to see it trading at the lowest level since 2008. The supply side is catching most of the market’s attention as Iran added to the Saudi commentary overnight in looking to further increase its production. Demand in the US and China has not yet materially responded to the price shift for a fundamental shift to happen.
However, oil (both Brent and WTI) is now trading under fair value according to Deutsche bank. A pattern that never lasts more than two weeks and normally averages four days (we are now into the second day).
There are signs that the ASX is coming to the critical point where sustained selling will be questioned. The Fed, RBA minutes and MYEFO might give the ASX the final little push it needs to the downside to get buyers to finally see value worth backing – be bold, because the value is there.
Ahead of the Australian Open
The SPI and our out-of-hours markets see the ASX down a further 25 points to 4903. However, we have started to see buying coming in when the ASX touched 4900 points. Iron ore added 2% yesterday and all industrial metals were in the black in London.
BHP’s capitulation is also coming to a point of finality; I believed it was a trap in the $20 handle and there is likely to be further bad news at the half year numbers, however even with this factored in, its discount net present value is over 25% a level that in the past has led to buying.
These calls may not come to fruition today or even in the next few days, but the Australian market is primed for a rally.
Asian markets opening call
Price at 8:00am AEDT
Change from the Offical market close
Percentage Change
Australia 200 cash (ASX 200)
4,903.30
-25
-0.51%
Japan 225 (Nikkei)
18,721.50
-162
-0.86%
Hong Kong HS 50 cash (Hang Seng)
21,201.10
-109
-0.51%
China H-shares cash
9,259.80
-56
-0.60%
Singapore Blue Chip cash (MSCI Singapore)
312.82
-2
-0.76%
Futures Markets
Price at 8:00am AEDT
Change Since Australian Market Close
Percentage Change
Dow Jones Futures (December)
17,273.00
-34.00
-0.20%
S&P Futures (December)
2,010.88
-5.75
-0.29%
ASX SPI Futures (December)
4,904.50
-20.00
-0.39%
NKY 225 Futures (March)
18,757.50
-77.50
-0.41%
Key inputs for the upcoming Australian trading session (Change are from 16:00 AEDT )
Price at 8:00am AEDT
Change Since Australian Market Close
Percentage Change
AUD/USD
$0.7242
0.0045
0.63%
USD/JPY
¥120.835
-0.225
-0.19%
Rio Tinto Plc (London)
£18.59
-0.27
-1.42%
BHP Billiton Plc (London)
£6.82
-0.13
-1.83%
BHP Billiton Ltd. ADR (US) (AUD)
$16.31
-0.29
-1.75%
Commonwealth Bank ADR (US) (AUD)
$77.19
-0.25
-0.32%
Metals Exchanges
Price at 8:00am AEDT
Change Since Australian Market Close
Percentage Change
Gold (spot)
$1,065.31
-11.04
-1.03%
Brent Crude (January)
$37.93
0.22
0.60%
Aluminium (London)
1484.5
1.00
0.07%
Copper (London)
4680.5
3.50
0.07%
Nickel (London)
8775
85.00
0.98%
Zinc (London)
1547
2.00
0.13%
Iron Ore (62%Fe Qingdao)
$39.06
0.76
1.98%
IG Iron Ore (CNH)
¥295.15
1.50
0.51%
IG provides round-the-clock CFD trading on currencies, indices and commodities. The levels quoted in this email are the latest tradeable price for each market. The net change for each market is referenced from the corresponding tradeable level at yesterday’s close of the ASX. These levels are specifically tailored for the Australian trader and take into account the 24hr nature of global markets.
Please contact IG if you require market commentary or the latest dealing price.
EVAN LUCAS
Market Strategist
IG, Level 15, 55 Collins Street, Melbourne VIC 3000
D: +61398601748 | T: +61398601711www.ig.com
[Kick off your trading day with our newsletter]
More from IBT Markets:
Follow us on Facebook
Follow us on Twitter
Subscribe to get this delivered to your inbox daily
-

Taylor Swift's 'The Tortured Poets Department' Set To Drop
-

Israel Bombs Gaza As Middle East Tense After Iranian Attack
-
Act Fast Or Fall Behind China, US For Good, EU Leaders Told
-

Indonesia Evacuating Thousands After Volcano Erupts, Causes Tsunami Threat
-

Solomons' PM Contender Vows To Abolish China Security Pact


