Global Market Overview - August 24, 2015

Horrible statistics
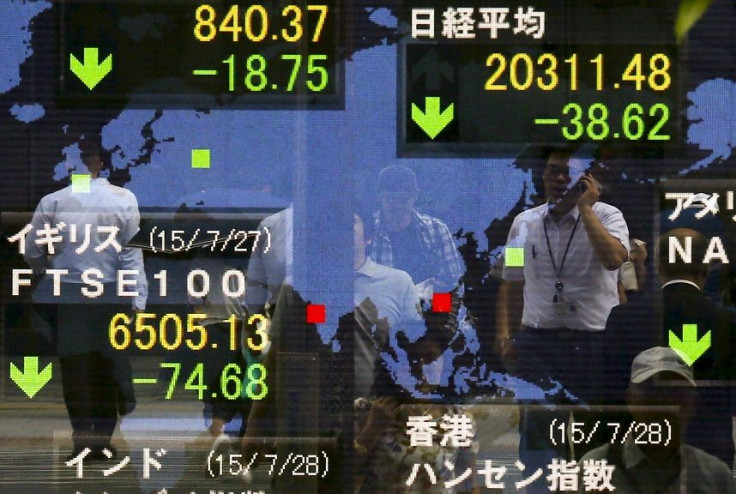
Today has all the hallmarks of being one of the worst trading days of the past five years; in the post GFC world, fear-selling is now stronger, faster and harder than ever before, and now there’s another pressure to it – are central banks out of tricks?
Emerging markets will be the epicentre of the fear selling as deflationary fears and growth-less economy fears produce GFC-like volatility with China taking the lead on that theory.
The reaction from Asia today will be symptomatic of the current investor sentiment and belief that a hard landing is inevitable (something I don’t buy as China has a plethora of leavers it can pull to slow this down) will only heighten capital outflows.
However, no major action was taken by China over the weekend which means Asia will be left largely to its own devices this morning.
The Fed is also the other risk to EMs and the risk of rising US-denoted debt leading to capital outflows, coupled with half decade low commodity prices is not a good mix. However, this is sentiment-driven and that drives fear even harder. Therefore, by the end of the week, expect to see a bounce as it will be overdone.
The current trading conditions will likely lead to a new coined market term ‘Hike Hysteria’ or ‘China Crumble’. Both seem very appropriate in the current conditions.
The (horrible) stats that matter
- Oil is below US$40 a barrel for the first time since 2009 and logged its longest weekly losing streak in 29 years.
- DOW is down over 1000 points for the week. The S&P is below 2000 points for the first time since January 30 and had its largest intraday move in over four years, down 3.2%.
- Equity outflow last week was at the highest it’s been in three months – US$8.3 billion was withdrawn from global funds. US$6 billion of that was from EM funds.
- Copper is below US$5000 a tonne and logged seven weekly losses in a row. One more, and it will equal the 2009 record.
- Gold is on track for the best weekly gain since January and is well above US$1100 an ounce.
- Bond markets had one of best weeks in the past three months.
- The ASX has lost 8.95% in August (it down 9.5% since 4 August), its worst month since September 2009. It’s lost 13.7% since the April high.
- CBA has lost over 23%, or $23.50, since its intraday top – three of the four banks are in bear markets.
- Resources stocks now make up 14.7% of the ASX from 33% in March 2011. Financials 40% from 30% in March 2011.
- The ASX is now trading on a trailing P/E of 15 times; it is as cheap as it was in 2012 with a dividend yield is 4.7% which is above the five-year average of 4.4%. A warning here: the knife hasn’t hit the floor yet.
- SPI futures are pointing down 110 points which begs the question – will we see a four in front of the ASX soon? It is very possible.
Asian markets opening call
Price at 8:00am AEDT
Change from the Offical market close
Percentage Change
Australia 200 cash (ASX 200)
5,096.60
-118
-2.26%
Japan 225 (Nikkei)
18,975.00
-461
-2.37%
Hong Kong HS 50 cash (Hang Seng)
21,847.20
-562
-2.51%
China H-shares cash
9,981.80
-213
-2.09%
Singapore Blue Chip cash (MSCI Singapore)
320.10
-9
-2.71%
US and Europe Market Calls
Price at 8:00am AEDT
Change Since Australian Market Close
Percentage Change
WALL STREET (cash) (Dow)
16,468.60
-389
-2.36%
US 500 (cash) (S&P)
1,971.48
-49
-2.46%
UK FTSE (cash)
6,132.20
-138
-2.11%
German DAX (cash)
9,994.60
-216
-2.12%
Futures Markets
Price at 8:00am AEDT
Change Since Australian Market Close
Percentage Change
Dow Jones Futures (September)
16,437.00
-392.00
-2.33%
S&P Futures (September)
1,969.00
-47.88
-2.37%
ASX SPI Futures (September)
5,057.50
-114.00
-2.20%
NKY 225 Futures (September)
18,970.00
-475.00
-2.44%
Key inputs for the upcoming Australian trading session (Change are from 16:00 AEDT )
Price at 8:00am AEDT
Change Since Australian Market Close
Percentage Change
AUD/USD
$0.7309
0.0003
0.04%
USD/JPY
¥121.920
-1.065
-0.87%
Rio Tinto Plc (London)
£23.25
-0.36
-1.52%
BHP Billiton Plc (London)
£10.79
-0.13
-1.21%
BHP Billiton Ltd. ADR (US) (AUD)
$23.73
-0.37
-1.55%
Gold (spot)
$1,160.60
-1.45
-0.12%
Iron Ore (62%Fe Qingdao)
$56.10
0.26
0.47%
IG provides round-the-clock CFD trading on currencies, indices and commodities. The levels quoted in this email are the latest tradeable price for each market. The net change for each market is referenced from the corresponding tradeable level at Friday’s close of the ASX. These levels are specifically tailored for the Australian trader and take into account the 24hr nature of global markets.
Please contact IG if you require market commentary or the latest dealing price.
EVAN LUCAS Market Strategist
[Kick off your trading day with our newsletter]
More from IBT Markets:
Follow us on Facebook
Follow us on Twitter
Subscribe to get this delivered to your inbox daily


